


Incerteza da classificação racial
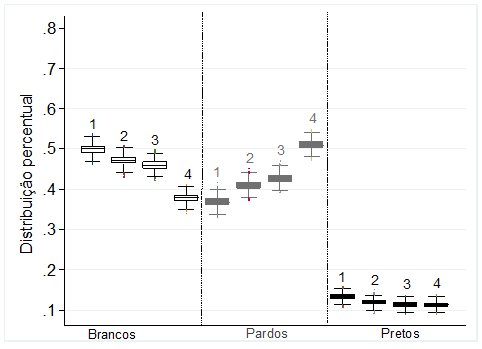
Este gráfico apresenta intervalos de confiança estatística de 95% para a distribuição percentual da população entre os termos branco, pardo e preto segundo a metodologia de coleta da informação racial. A distribuição da população por cor varia segundo a metodologia utilizada na coleta e as opções disponíveis para a escolha dos entrevistados (ou entrevistador). É preciso, portanto, controlar esses fatores de variação para que se tenha um efeito puro do modo de coleta da informação sobre cor. Esta figura faz isso ao apresentar os intervalos percentuais de brancos, pardos e pretos em cada uma das metodologias de coleta da PESB 2002. Legenda do gráfico: 1 = IBGE; 2 = fotografia; 3 = entrevistador; 4 = ascendência. Para maiores detalhes veja: MUNIZ, J. 2012. Preto no branco? Mensuração, relevância e concordância classificatória no país da incerteza racial. Dados, 55(1): 251-282.
The decomposition of economic outcomes as a result of changes in Brazil’s male age-education structure
In Brazil, the age and education compositions of the male labor force is changing with great regional variation. Based on Demographic Census microdata, results indicate that cohort size has a negative impact on earnings, but this effect is decreasing over time. In this study we consider the impact on earnings by age and education, as well as estimated income inequality reduction and racial differentials. Fertility decline and improvements regarding educational attainment had a significant influence on the decline of income inequality in the country. Moreover, the non-white population has been experiencing less success in relation to educational achievement, compared to the white population. Formore details, see:AMARAL, E.F.L. 2012. The decomposition of economic outcomes as a result of changes in Brazil’s male age-education structure. Population Research and Policy Review.
Spatial dependence and heterogeneity in tem years of fertility decline in Brazil

This figure provides local goodness of fit statistics for geographically weighted regressions constructed to estimate the association Brazilian fertility in 1991 and 2000 and indicators of education, child mortality, and the prevalence of the fertility in the neighboring areas. The models point that there is a lot of variation in the parameters and in the performance of the models over space. In 1991 and 2000, local adjusted-R2 values indicate, for instance, that the models performed particularly well in the North region and in the northern parts of Minas Gerais and Goiás.Formore details, see:MUNIZ, J. 2009. Spatial dependence and heterogeneity in tem years of fertility decline in Brazil. Population Review 48(2):32-65.
A desigualdade de renda racial depende do tipo de classificação?

Each pair of columns is a different classification scheme. Within each pair, the one on the left shows the population composition. The one on the right shows the share of total income earned by members of each racial category. When the current census categories are used (Scenario A), the Brazilian population is comprised of a slight majority white population (52 per cent), followed by a very large mixed-race population (36 per cent) and a much smaller black segment (11 per cent). This classification scheme sustains a traditional view of Brazil as a ‘mixed’ country.In Scenario C, where Brazilians are forced to choose between classification as black or white, the population appears significantly whiter (68 per cent), with a smaller minority population (32 per cent).Our results show that adoption of a forced dichotomous format on official surveys could result in an unintended consequence: the swelling of the white side of the divide. When confronted with the binary format, fully 44 per cent of browns opt for the white category.Formore details, see:LOVEMAN, M., MUNIZ, J., BAILEY, S. R. 2011. Brazil in black and white? Race categories, the census, and the study of inequality.Ethnic and Racial Studies, 35(8): 1466-1483.
Qual a composição racial do Brasil?

This Figure shows that six classification schemes generate very different pictures of Brazil’s racial composition. The two ternary formats look most alike and show that browns make up a significant share of Brazil’s population. In contrast, the “post-hoc binary” scheme, which takes the picture generated by the census format and then eliminates the distinction between browns and blacks, portrays a population nearly evenly divided between whites and nonwhites. The other three binary classification schemes present varied pictures of Brazil’s racial composition. Two of these, “forced racial binary” and “photo comparison,” suggest that whites comprise upwards of 70 percent of the population. In contrast, judged by a “descent rule” based on parental race (similar to the rule of hypodescent), the nonwhite segment of the population forms a significant majority (at about 60 percent). In all of the dichotomous classification schemes, by definition, Brazil appears as a country divided between whites and nonwhites with no separate social space occupied by an intermediate or mixed-race population.Formore details, see:BAILEY, S., MUNIZ, J., LOVEMAN, M. 2012. Measures of "Race" and the Analysis of Racial Inequality in Brazil. Social Science Research.
Long term influences of age-education transition on the Brazilian labor market

For males between 35 and 49 years of age with 5–8 years of schooling, the figure illustrates that a larger proportion of males in this age-education group have increased negative effects on income in the Brazilian micro-regions. The coefficient is less negative over time.This negative impact tends to be more pronounced when the education level of the group is higher. This study estimates the long term mean earnings of the male Brazilian population, taking into account the aging process of the population and the increase in educational attainment. Using census data, household sample surveys, as well as population and education projections, estimates indicate that an aging population and an increase in education will have a two percent impact on the annual growth of an average income in Brazil by 2050. The challenge for the future is to improve the proportion of the Brazilian population with completed college degrees.For more details, see: AMARAL, E.F.L., RIOS-NETO, E.L.G., POTTER, J. E. 2012. Long term influences of age-education transition on the Brazilian labor market. Bulletin of Latin American Research, 31(3): 302-319.
The growth of Protestantism in Brazil and its impact on male earnings

We observed a strong and significant association between the proportion Protestant and male earnings across groups in Brazil defined on the basis of place, age and education, but the association was among those groups with the lowest level of education: those who had completed less than five years of schooling (example in the Figure). When we introduced race into our model, the relationship between Protestantism and earnings among males with low educational attainment was found to be greatest among groups with high proportions of non-whites. That is to say we found a strong relationship between earnings and Protestantism, but one that was mostly restricted to people of color with little education. Finally, looking at the three censuses between 1980 and 2000, while there was some decline in the size of the relevant coefficients through time, the three way interaction between race, religion and earnings among men with less than five years of education remained large and significant in each census. For more details, see: POTTER, J.E., AMARAL, E.F.L, WOODBERRY, R. The growth of Protestantism in Brazil and its impact on male earnings, 1970–2000. Submitted to Social Forces.
Políticas de población, programas gubernamentales y fecundidad: una comparación entre Brasil y México

El gobierno mexicano puso en práctica programas de planificación familiar desde los años setenta, en contraposición al gobierno brasileño que no implementó a políticas de población. Este trabajo estima la influencia de dichos políticas en las tendencias de fecundidad de mujeres de diferentes segmentos sociales, con modelos estadísticos que incorporan variables municipales e individuales. Se analizaron estados pobres y ricos tanto de Brasil como de México, usando datos de censos demográficos, estadísticas del registro civil, y encuestas de salud y demografía. Las diferencias de fecundidad por grupo socioeconómico son más acentuadas en los estados brasileños (Estado de Piauí en el Gráfico) que en los mexicanos. Los estados brasileños más pobres también presentan diferencias marcadas, pero en menor grado, porque en los estados mexicanos pobres un alto porcentaje de partos ocurría en los hogares. Se concluye que las políticas de planificación familiar disminuyen las diferencias de fecundidad entre mujeres de distintos niveles socioeconómicos. Más aun, estas políticas serían más eficaces si las mujeres de estados mexicanos pobres también tuvieran fácil acceso a hospitales y clínicas públicas. For more details, see: AMARAL, E.F.L., POTTER, J.E. 2009. Políticas de población, programas gubernamentales y fecundidad: una comparación entre Brasil y México. Notas de Población, 87: 7–33.